Grundlæggende statistik
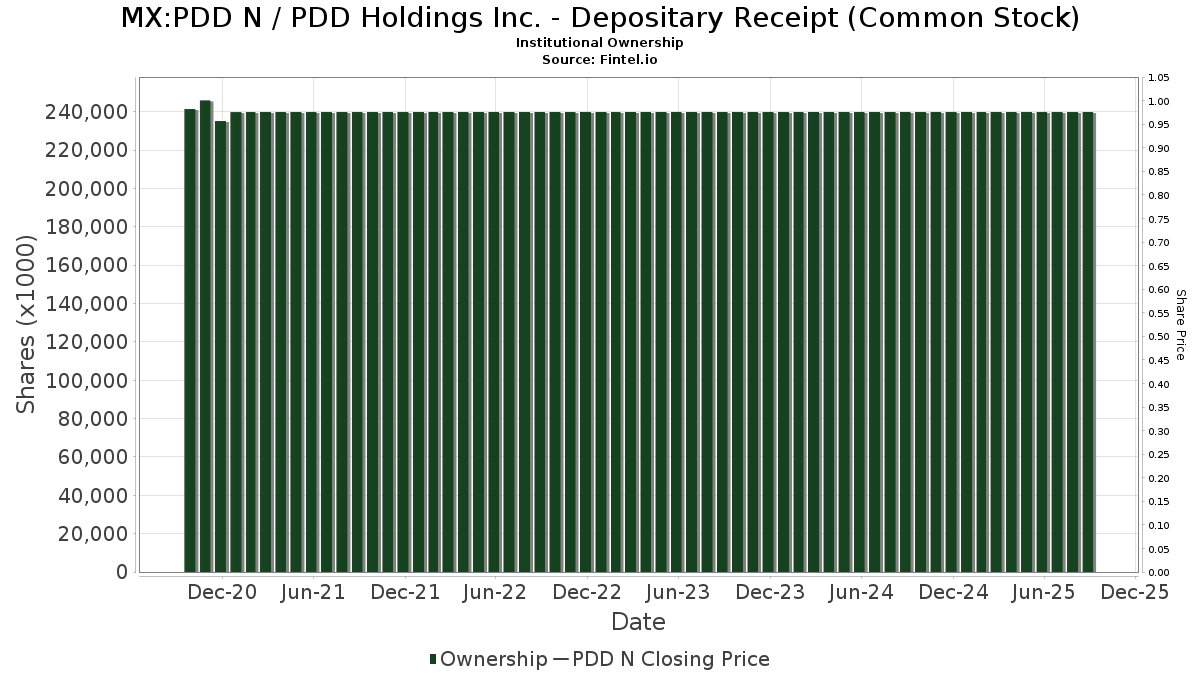
| Institutionelle ejere | 595 total, 542 long only, 0 short only, 53 long/short - change of 10,96% MRQ |
| Gennemsnitlig porteføljeallokering | 0.9557 % - change of -21,84% MRQ |
| Institutionelle aktier (lange) | 427.511.831 (ex 13D/G) - change of -5,96MM shares -2,42% MRQ |
| Institutionel værdi (lang) | $ 46.202.981 USD ($1000) |
Institutionelt ejerskab og aktionærer
PDD Holdings Inc. - Depositary Receipt (Common Stock) (MX:PDD N) har 595 institutionelle ejere og aktionærer, der har indsendt 13D/G- eller 13F-formularer til Securities Exchange Commission (SEC). Disse institutioner har i alt 427,511,831 aktier. Største aktionærer omfatter BlackRock, Inc., Vanguard Group Inc, Baillie Gifford & Co, Fmr Llc, State Street Corp, H&H International Investment, LLC, SC CHINA HOLDING Ltd, Hillhouse Capital Advisors, Ltd., Norges Bank, and Sc Us (ttgp), Ltd. .
PDD Holdings Inc. - Depositary Receipt (Common Stock) (BMV:PDD N) institutionel ejerskabsstruktur viser aktuelle positioner i virksomheden efter institutioner og fonde, samt seneste ændringer i positionsstørrelse. Større aktionærer kan omfatte individuelle investorer, investeringsforeninger, hedgefonde eller institutioner. Skema 13D angiver, at investoren besidder (eller besidder) mere end 5 % af virksomheden og har til hensigt (eller har til hensigt at) aktivt at forfølge en ændring i forretningsstrategi. Skema 13G indikerer en passiv investering på over 5%.
Fondens stemningsscore
Fund Sentiment Score (fka Ownership Accumulation Score) finder de aktier, der bliver mest købt af fonde. Det er resultatet af en sofistikeret, multi-faktor kvantitativ model, der identificerer virksomheder med de højeste niveauer af institutionel akkumulering. Scoringsmodellen bruger en kombination af den samlede stigning i oplyste ejere, ændringerne i porteføljeallokeringer i disse ejere og andre målinger. Tallet går fra 0 til 100, hvor højere tal indikerer et højere niveau af akkumulering for sine jævnaldrende, og 50 er gennemsnittet.
Opdateringsfrekvens: Dagligt
Se Ownership Explorer, som giver en liste over højest rangerende virksomheder.
AI+ Ask Fintel’s AI assistant about PDD Holdings Inc. - Depositary Receipt (Common Stock).
Select a question to share a public post with an AI-crafted answer.
Thinking of good questions…
13F og NPORT arkivering
Detaljer om 13F-arkivering er gratis. Detaljer om NP-ansøgninger kræver et premium-medlemskab. Grønne rækker angiver nye positioner. Røde rækker angiver lukkede positioner. Klik på linket ikon for at se den fulde transaktionshistorik.
Opgrader
for at låse premium-data op og eksportere til Excel ![]() .
.
Important Note
In an effort to reduce load times for our mobile users, we are testing some ways to deliver lighter pages.
In this first test, we will deliver only the most recent 750 transactions (out of 852 for this stock). If you are interested in loading *all* the transactions for this company, click the "load all" button below. This is just a test and if you don't like it, please let us know by submitting some gentle feedback via the link at the bottom of this page.
Load All| Fil dato | Kilde | Investor | Type | Gennemsnitlig pris (Øst) |
Aktier | Δ Aktier (%) |
Rapporteret Værdi ($1000) |
Δ Værdi (%) |
Port Alloc (%) |
|
|---|---|---|---|---|---|---|---|---|---|---|
| 2026-02-02 | 13F | Qrg Capital Management, Inc. | 10.605 | -2,05 | 1.203 | -16,00 | ||||
| 2026-04-15 | 13F | Exchange Traded Concepts, Llc | 222.057 | -8,51 | 22.690 | -17,56 | ||||
| 2026-02-05 | 13F | Bank Julius Baer & Co. Ltd, Zurich | 675 | -0,15 | 77 | -14,61 | ||||
| 2026-02-13 | 13F | Ieq Capital, Llc | 11.666 | -6,64 | 1.323 | -19,93 | ||||
| 2026-04-20 | 13F | Amiral Gestion | 27.000 | -3,57 | 2.759 | -13,11 | ||||
| 2026-04-24 | 13F | Key FInancial Inc | 82 | 0,00 | 8 | -11,11 | ||||
| 2026-02-10 | 13F | Crake Asset Management LLP | 46.000 | 5.216 | ||||||
| 2026-02-13 | 13F | Causeway Capital Management Llc | 371.241 | 19,89 | 42.095 | 2,86 | ||||
| 2026-04-20 | 13F | Hilton Head Capital Partners, LLC | 5 | 1 | ||||||
| 2026-02-17 | 13F | GAM Holding AG | 22.196 | -51,43 | 2.517 | -58,34 | ||||
| 2026-01-14 | 13F | Hennion & Walsh Asset Management, Inc. | 6.502 | 4,03 | 737 | -10,77 | ||||
| 2026-02-17 | 13F | Advisory Services Network, LLC | 16.451 | 6,42 | 1.865 | -8,71 | ||||
| 2026-02-26 | 13F | Ssa Swiss Advisors Ag | 27.445 | 0,00 | 3.125 | -12,66 | ||||
| 2026-01-29 | 13F | UBS Group AG | Put | 2.843.100 | 11,73 | 322.379 | -4,15 | |||
| 2026-02-17 | 13F | one8zero8, LLC | 2.300 | 261 | ||||||
| 2026-01-29 | 13F | UBS Group AG | Call | 2.739.663 | 4,38 | 310.650 | -10,45 | |||
| 2026-01-29 | 13F | UBS Group AG | 4.148.190 | 68,25 | 470.363 | 44,35 | ||||
| 2026-02-12 | 13F | California Public Employees Retirement System | 1.195.822 | 0,13 | 135.594 | -14,09 | ||||
| 2026-02-11 | 13F | IvyRock Asset Management (HK) Ltd | 991.509 | -4,23 | 112.427 | -17,83 | ||||
| 2026-02-17 | 13F | Nearwater Capital Markets, Ltd | 83.100 | 0,00 | 9.423 | -14,21 | ||||
| 2026-02-10 | 13F | Hazlett, Burt & Watson, Inc. | 0 | -100,00 | 0 | |||||
| 2026-02-13 | 13F | Golden State Wealth Management, LLC | 6 | 0,00 | 1 | |||||
| 2026-01-21 | 13F | All-Stars Investment Ltd | 31.650 | -9,57 | 3.589 | -22,42 | ||||
| 2026-02-17 | 13F | Oberweis Asset Management Inc/ | 0 | -100,00 | 0 | |||||
| 2026-03-04 | 13F | Rehmann Capital Advisory Group | 2.122 | 0,28 | 241 | -13,98 | ||||
| 2026-02-13 | 13F | Edgestream Partners, L.P. | 0 | -100,00 | 0 | |||||
| 2026-02-13 | 13F | BNP Paribas Asset Management Holding S.A. | 499.516 | 36,08 | 57 | 16,67 | ||||
| 2026-02-13 | 13F | Headlands Technologies LLC | 5.974 | -64,63 | 677 | -69,67 | ||||
| 2026-02-13 | 13F | Resources Investment Advisors, LLC. | 1.889 | -5,03 | 214 | -18,32 | ||||
| 2026-02-13 | 13F | Boston Partners | 0 | -100,00 | 0 | |||||
| 2026-02-10 | 13F | Acadian Asset Management Llc | 1.411.514 | 27,73 | 160 | 9,59 | ||||
| 2025-11-14 | 13F | Think Investments LP | 0 | -100,00 | 0 | |||||
| 2026-02-13 | 13F | National Bank Of Canada /fi/ | 1.428.593 | 135,86 | 161.988 | 102,35 | ||||
| 2026-02-17 | 13F | Holocene Advisors, LP | 0 | -100,00 | 0 | -100,00 | ||||
| 2026-02-13 | 13F | Wexford Capital Lp | 30.371 | 9.075,53 | 3.444 | 7.906,98 | ||||
| 2026-02-17 | 13F | Norinchukin Bank, The | 25.317 | 19,22 | 2.871 | 2,28 | ||||
| 2026-01-21 | 13F | Greenleaf Trust | 2.001 | -1,09 | 227 | -15,36 | ||||
| 2026-02-11 | 13F | Capital International Investors | 4.698.655 | 20,75 | 532.780 | 3,59 | ||||
| 2026-04-14 | 13F | Focus Financial Network, Inc. | 0 | -100,00 | 0 | |||||
| 2026-02-17 | 13F | Orbis Allan Gray Ltd | 1.168.327 | -83,17 | 132.477 | -85,56 | ||||
| 2025-12-15 | 13F | FNY Investment Advisers, LLC | Call | 0 | -100,00 | 0 | ||||
| 2026-02-11 | 13F | Group One Trading, L.p. | Call | 2.075.700 | 55,13 | 235.364 | 33,09 | |||
| 2026-02-13 | 13F | Panagora Asset Management Inc | 123.896 | -39,85 | 14.049 | -48,39 | ||||
| 2026-02-11 | 13F | Group One Trading, L.p. | Put | 940.000 | 3,79 | 106.587 | -10,96 | |||
| 2026-02-12 | 13F | Voya Investment Management Llc | 225.227 | 22,93 | 25.538 | 5,46 | ||||
| 2025-10-30 | 13F | Ridgewood Investments LLC | Call | 0 | -100,00 | 0 | ||||
| 2025-10-30 | 13F | Ridgewood Investments LLC | 0 | -100,00 | 0 | |||||
| 2026-03-09 | 13F/A | CI Private Wealth, LLC | 8.440 | 0,90 | 957 | -13,39 | ||||
| 2026-02-11 | 13F | Krane Funds Advisors LLC | 6.397.960 | 4,22 | 725.465 | -8,45 | ||||
| 2026-02-17 | 13F | Public Employees Retirement System Of Ohio | 197.711 | -11,54 | 22.418 | -24,11 | ||||
| 2026-02-10 | 13F | Turn8 Private Wealth Inc. | 24.446 | 0,00 | 2.772 | -14,24 | ||||
| 2025-11-14 | 13F | Public Investment Fund | 0 | -100,00 | 0 | -100,00 | ||||
| 2026-04-22 | 13F | Pictet Asset Management Holding SA | 899.487 | -26,98 | 91.910 | -34,20 | ||||
| 2026-02-02 | 13F | Chung Wu Investment Group, LLC | 1.800 | 0,00 | 204 | -13,92 | ||||
| 2026-02-12 | 13F | M&G Plc | 325.505 | -0,03 | 36.782 | -14,42 | ||||
| 2026-02-17 | 13F | Susquehanna Advisors Group, Inc. | 0 | -100,00 | 0 | -100,00 | ||||
| 2026-02-13 | 13F | SC CHINA HOLDING Ltd | 11.348.426 | 0,00 | 1.203.728 | -18,85 | ||||
| 2026-01-23 | 13F | Howard Capital Management Inc. | 14.034 | 2,90 | 1.591 | -11,71 | ||||
| 2026-01-22 | 13F/A | Cresset Asset Management, LLC | 0 | -100,00 | 0 | |||||
| 2026-01-22 | 13F/A | Cresset Asset Management, LLC | Put | 0 | -100,00 | 0 | ||||
| 2026-02-19 | 13F | Atomi Financial Group, Inc. | 9.119 | 9,39 | 1.034 | -6,09 | ||||
| 2025-11-14 | 13F | Equitable Holdings, Inc. | 0 | -100,00 | 0 | |||||
| 2026-02-13 | 13F | Sc Us (ttgp), Ltd. | 8.841.576 | 0,00 | 1.002.546 | -14,21 | ||||
| 2025-11-10 | 13F | Garda Capital Partners Lp | Put | 0 | -100,00 | 0 | ||||
| 2025-11-10 | 13F | Garda Capital Partners Lp | Call | 0 | -100,00 | 0 | ||||
| 2026-01-29 | 13F | Vanguard Group Inc | 32.810.630 | 1,32 | 3.720.397 | -13,08 | ||||
| 2025-11-10 | 13F | Garda Capital Partners Lp | 0 | -100,00 | 0 | |||||
| 2026-02-13 | 13F | Goldstream Capital Management Ltd | 0 | -100,00 | 0 | |||||
| 2026-02-17 | 13F | Owl Creek Asset Management, L.P. | 0 | -100,00 | 0 | |||||
| 2026-02-17 | 13F | Qube Research & Technologies Ltd | Call | 518.900 | -12,64 | 58.838 | -25,05 | |||
| 2026-02-12 | 13F | AI-Squared Management Ltd | 27.143 | -84,96 | 3.078 | -87,10 | ||||
| 2026-02-17 | 13F | FACT Capital, LP | 73.156 | 20,07 | 8.295 | 3,02 | ||||
| 2026-02-13 | 13F | Korea Investment CORP | 554.687 | 1,61 | 62.896 | -12,83 | ||||
| 2026-02-17 | 13F | SRS Investment Management, LLC | 1.016.859 | -61,69 | 115.302 | -67,13 | ||||
| 2026-02-10 | 13F | Catalyst Capital Advisors LLC | 278 | -14,98 | 32 | -27,91 | ||||
| 2026-02-12 | 13F | Federation des caisses Desjardins du Quebec | 50.105 | 53,77 | 5.681 | 31,93 | ||||
| 2026-02-13 | 13F | Marathon Trading Investment Management LLC | 62.986 | 57,92 | 7.142 | 35,48 | ||||
| 2026-02-13 | 13F | Marathon Trading Investment Management LLC | Call | 58.200 | 7,98 | 6.599 | -7,36 | |||
| 2026-02-17 | 13F | Cetera Investment Advisers | 10.865 | -1,81 | 1.232 | -15,80 | ||||
| 2026-02-13 | 13F | Manufacturers Life Insurance Company, The | 484.402 | 97,44 | 54.981 | 69,56 | ||||
| 2026-02-13 | 13F | Marathon Trading Investment Management LLC | Put | 173.000 | 25,82 | 19.616 | 7,94 | |||
| 2026-02-17 | 13F | Polar Capital Holdings Plc | 577.391 | 3,87 | 65.470 | -10,89 | ||||
| 2025-11-04 | 13F | Blue Creek Capital Management Ltd | 116.721 | 0,00 | 15.427 | 26,29 | ||||
| 2026-02-17 | 13F | Qube Research & Technologies Ltd | Put | 565.500 | 0,89 | 64.122 | -13,44 | |||
| 2026-02-19 | 13F/A | Himalaya Capital Management LLC | 4.608.000 | 0,00 | 522.501 | -14,21 | ||||
| 2026-04-10 | 13F | Henry James International Management Inc. | 16.148 | 0,00 | 1.650 | -9,89 | ||||
| 2026-02-17 | 13F | Susquehanna Advisors Group, Inc. | Put | 0 | -100,00 | 0 | -100,00 | |||
| 2026-02-17 | 13F | Tiger Pacific Capital LP | 0 | -100,00 | 0 | |||||
| 2026-02-02 | 13F | Advisors Preferred, LLC | 3.436 | 265,53 | 398 | 215,08 | ||||
| 2026-02-13 | 13F | Natixis | 7.459 | -75,51 | 846 | -79,01 | ||||
| 2026-02-12 | 13F | ICICI Prudential Asset Management Co Ltd | 10.719 | 4,50 | 1.215 | -10,33 | ||||
| 2026-02-06 | 13F | HighTower Advisors, LLC | 8.486 | -34,34 | 962 | -43,68 | ||||
| 2026-03-12 | 13F/A | Peak6 Llc | Put | 1.470.400 | 18,75 | 166.729 | 1,88 | |||
| 2026-03-12 | 13F/A | Peak6 Llc | Call | 770.800 | -67,81 | 87.401 | -72,38 | |||
| 2026-02-11 | 13F | Ramirez Asset Management, Inc. | 90 | 0,00 | 10 | -9,09 | ||||
| 2026-03-12 | 13F/A | Peak6 Llc | 435.042 | 1.604,24 | 49.329 | 1.362,47 | ||||
| 2026-02-12 | 13F | BlackRock, Inc. | 39.152.152 | 9,23 | 4.439.463 | -6,29 | ||||
| 2026-02-13 | 13F | Citigroup Inc | 1.543.816 | -28,64 | 175.053 | -38,78 | ||||
| 2026-02-06 | 13F | Larson Financial Group LLC | 405 | 0,75 | 46 | -15,09 | ||||
| 2026-02-13 | 13F | Citigroup Inc | Call | 507.000 | -4,34 | 57.489 | -17,93 | |||
| 2026-02-13 | 13F | Citigroup Inc | Put | 1.077.000 | 15,78 | 122.121 | -0,67 | |||
| 2026-02-12 | 13F | BRILLIANCE ASSET MANAGEMENT Ltd | 595.174 | 67.487 | ||||||
| 2026-02-17 | 13F | SageView Advisory Group, LLC | 47 | 5 | ||||||
| 2026-02-13 | 13F | QVT Financial LP | 6.042 | 27,79 | 685 | 9,78 | ||||
| 2026-02-11 | 13F | Parallel Advisors, LLC | 3.110 | -0,64 | 353 | -14,77 | ||||
| 2026-02-13 | 13F | Charles-Lim Capital Ltd | 500.000 | -16,67 | 56.695 | -28,51 | ||||
| 2026-02-12 | 13F | Campbell & CO Investment Adviser LLC | 2.696 | -87,23 | 306 | -89,06 | ||||
| 2026-02-13 | 13F | SRS Capital Advisors, Inc. | 1.112 | -6,95 | 126 | -19,75 | ||||
| 2026-02-12 | 13F | Steward Partners Investment Advisory, Llc | 925 | 7,81 | 105 | -7,96 | ||||
| 2026-02-05 | 13F | WIM INVESTMENT MANAGEMENT Ltd | 0 | -100,00 | 0 | |||||
| 2026-02-12 | 13F | Brown Brothers Harriman & Co | 27 | 68,75 | 3 | 50,00 | ||||
| 2026-04-17 | 13F | Bell Investment Advisors, Inc | 87 | 19,18 | 9 | 0,00 | ||||
| 2025-11-14 | 13F | Public Investment Fund | Call | 0 | -100,00 | 0 | -100,00 | |||
| 2025-11-14 | 13F | Principal Street Partners, LLC | 0 | -100,00 | 0 | |||||
| 2026-02-05 | 13F | Allworth Financial LP | 237 | -7,42 | 27 | -21,21 | ||||
| 2026-04-21 | 13F/A | Corsair Capital Management, L.p. | 0 | -100,00 | 0 | |||||
| 2026-02-17 | 13F | Tower Research Capital LLC (TRC) | 38.324 | 329,83 | 4.346 | 268,85 | ||||
| 2026-04-13 | 13F | True Wealth Design, LLC | 46 | 318,18 | 5 | 300,00 | ||||
| 2025-11-12 | 13F | Keystone Investors Pte Ltd | 0 | -100,00 | 0 | -100,00 | ||||
| 2026-02-12 | 13F | Polen Capital Management Llc | 0 | -100,00 | 0 | |||||
| 2026-04-21 | 13F | Vise Technologies, Inc. | 15.131 | 0,00 | 1.716 | 0,00 | ||||
| 2026-02-05 | 13F | AustralianSuper Pty Ltd | 79.200 | 91,20 | 8.980 | 64,05 | ||||
| 2026-02-17 | 13F | Liontrust Investment Partners LLP | 36.392 | -53,51 | 4.126 | -60,12 | ||||
| 2026-04-21 | 13F | Financial Consulate, Inc | 6 | 100,00 | 1 | |||||
| 2026-02-11 | 13F | BIT Capital GmbH | 5.356 | -97,08 | 607 | -97,50 | ||||
| 2026-01-28 | 13F | Klp Kapitalforvaltning As | 181.400 | 7,85 | 20.569 | -7,48 | ||||
| 2026-02-11 | 13F | OPTIMAS CAPITAL Ltd | 120.256 | 269,46 | 13.636 | 216,95 | ||||
| 2026-02-06 | 13F | Profund Advisors Llc | 94.291 | 1,93 | 10.692 | -12,56 | ||||
| 2025-11-14 | 13F | Binnacle Investments Inc | 271 | 281,69 | 36 | 400,00 | ||||
| 2026-02-11 | 13F | West Family Investments, Inc. | 3.144 | -21,91 | 356 | -33,08 | ||||
| 2026-04-13 | 13F | IFP Advisors, Inc | 1.360 | -55,41 | 139 | -60,00 | ||||
| 2026-02-20 | 13F | Kovitz Investment Group Partners, LLC | 8.847 | 1.003 | ||||||
| 2026-02-17 | 13F | Cantor Fitzgerald, L. P. | Put | 50.000 | 5.670 | |||||
| 2026-02-17 | 13F | Cantor Fitzgerald, L. P. | 109.110 | 99,33 | 12.372 | 129,94 | ||||
| 2026-02-17 | 13F | Point72 Asset Management, L.P. | 0 | -100,00 | 0 | -100,00 | ||||
| 2026-02-13 | 13F | Prudential Financial Inc | 60.984 | 9,04 | 6.941 | -6,09 | ||||
| 2025-10-30 | 13F | Twin Peaks Wealth Advisors, LLC | 0 | -100,00 | 0 | |||||
| 2026-04-15 | 13F | FNY Investment Advisers, LLC | 600 | 0 | ||||||
| 2026-02-13 | 13F | Sculptor Capital LP | Put | 0 | -100,00 | 0 | -100,00 | |||
| 2026-02-17 | 13F | DV Trading LLC | 452 | 51 | ||||||
| 2026-02-13 | 13F | Verition Fund Management LLC | Put | 88.200 | -45,01 | 10.001 | -52,83 | |||
| 2026-02-13 | 13F | Verition Fund Management LLC | Call | 199.700 | 41,33 | 22.644 | 21,25 | |||
| 2026-02-17 | 13F | Parallax Volatility Advisers, L.P. | Put | 487.400 | 18,70 | 55.266 | 1,84 | |||
| 2026-02-17 | 13F | Parallax Volatility Advisers, L.P. | Call | 649.100 | -18,32 | 73.601 | -29,93 | |||
| 2026-02-17 | 13F | Parallax Volatility Advisers, L.P. | 187.904 | 21.306 | ||||||
| 2025-11-12 | 13F | NewSquare Capital LLC | 0 | -100,00 | 0 | |||||
| 2026-02-10 | 13F | Nomura Asset Management Co Ltd | 128.886 | 4,91 | 14.614 | -10,00 | ||||
| 2026-02-13 | 13F | Kestra Advisory Services, LLC | 564 | 64 | ||||||
| 2026-02-13 | 13F | Verition Fund Management LLC | 31.797 | -68,30 | 3.605 | -72,81 | ||||
| 2026-02-12 | 13F | Barings Llc | 654.567 | 21,44 | 74.221 | 4,19 | ||||
| 2026-02-12 | 13F | Renaissance Technologies Llc | 273.900 | 66,61 | 31.058 | 42,94 | ||||
| 2026-02-13 | 13F | Pinpoint Asset Management (Singapore) Pte. Ltd. | 625.807 | 1,08 | 70.960 | -13,28 | ||||
| 2026-04-16 | 13F | TB Alternative Assets Ltd. | 340.228 | 0,00 | 34.764 | -9,89 | ||||
| 2026-02-17 | 13F | Cardiff Park Advisors, Llc | 4.556 | 0,00 | 517 | -14,29 | ||||
| 2026-02-17 | 13F | SummitTX Capital, L.P. | 4.528 | 513 | ||||||
| 2026-02-04 | 13F | Swiss Life Asset Management Ltd | 92.430 | 31,62 | 10.481 | 12,92 | ||||
| 2026-02-03 | 13F | Maxi Investments CY Ltd | 14.308 | 2 | ||||||
| 2026-02-13 | 13F | Hudson Bay Capital Management LP | 0 | -100,00 | 0 | |||||
| 2026-02-17 | 13F | California State Teachers Retirement System | 309.209 | -4,97 | 35.061 | -18,47 | ||||
| 2026-02-17 | 13F | Capitolis Liquid Global Markets LLC | 72.000 | -5,26 | 8.164 | -18,72 | ||||
| 2026-02-17 | 13F | Wellington Management Group Llp | 810.863 | -9,36 | 91.944 | -22,24 | ||||
| 2025-11-07 | 13F | Prospect Financial Services LLC | 0 | -100,00 | 0 | -100,00 | ||||
| 2026-01-29 | 13F | Matthews International Capital Management Llc | 370.640 | -24,94 | 42.027 | -35,61 | ||||
| 2026-02-05 | 13F | Td Private Client Wealth Llc | 3 | 0,00 | 0 | |||||
| 2026-02-17 | 13F | Nomura Holdings Inc | 384.271 | 276,84 | 43.572 | 223,31 | ||||
| 2026-01-27 | 13F | Zurcher Kantonalbank (Zurich Cantonalbank) | 286.726 | 44,68 | 32.512 | 24,12 | ||||
| 2026-02-06 | 13F | Global Retirement Partners, LLC | 1.389 | 214,25 | 157 | 170,69 | ||||
| 2026-02-12 | 13F | Groupe la Francaise | 0 | -100,00 | 0 | |||||
| 2026-02-18 | 13F | GWM Advisors LLC | 4.543 | -16,26 | 515 | -28,17 | ||||
| 2026-01-29 | 13F | China Universal Asset Management Co., Ltd. | 40.052 | 41,24 | 4.541 | 21,19 | ||||
| 2026-02-17 | 13F | Ameriprise Financial Inc | 253.111 | -62,39 | 28.700 | -67,73 | ||||
| 2026-02-17 | 13F | Tcw Group Inc | 4.881 | 553 | ||||||
| 2026-02-13 | 13F | Polymer Capital Management (HK) LTD | 378.574 | 107,80 | 42.927 | 78,27 | ||||
| 2025-11-14 | 13F | Wetherby Asset Management Inc | 10.622 | 0,21 | 1.404 | 26,51 | ||||
| 2026-02-17 | 13F | Orland Properties Ltd | 138.835 | 0,00 | 15.743 | -14,21 | ||||
| 2026-02-12 | 13F | New York State Common Retirement Fund | 69.234 | -17,23 | 7.850 | -28,99 | ||||
| 2026-01-08 | 13F | Tuttle Tactical Management LLC | 8.866 | 37,93 | 1.005 | 18,37 | ||||
| 2026-02-09 | 13F | Fisher Asset Management, LLC | 573.184 | -0,48 | 64.993 | -14,62 | ||||
| 2026-02-12 | 13F | SWAN Capital LLC | 8 | 0,00 | 1 | -100,00 | ||||
| 2026-02-17 | 13F | Shelton Capital Management | 76.164 | 9,94 | 8.636 | -5,68 | ||||
| 2026-02-13 | 13F | Itau Unibanco Holding S.A. | 136.375 | 15.464 | ||||||
| 2026-02-09 | 13F | Geode Capital Management, Llc | 6.759.780 | 5,62 | 761.720 | -9,33 | ||||
| 2026-02-13 | 13F | Sanders Capital, LLC | 8.112.327 | -0,26 | 919.857 | -14,43 | ||||
| 2026-02-17 | 13F | Delaware Management Holdings, Inc. | 1.049.894 | 119.048 | ||||||
| 2026-02-17 | 13F | NEOS Investment Management LLC | 279.363 | 36,70 | 31.677 | 17,28 | ||||
| 2026-03-09 | 13F | EMC Capital Management | 500 | -50,00 | 0 | |||||
| 2026-02-04 | 13F | Kepler Cheuvreux (Suisse) SA | 28.007 | 8,04 | 3.176 | -7,33 | ||||
| 2026-02-17 | 13F | Rwc Asset Advisors (us) Llc | 24.040 | 2.726 | ||||||
| 2026-02-13 | 13F | Candriam Luxembourg S.C.A. | 139.800 | -20,11 | 15.853 | -31,46 | ||||
| 2026-01-21 | 13F | Sound Income Strategies, LLC | 6 | 0,00 | 1 | |||||
| 2026-04-22 | 13F | ABN AMRO Bank N.V. | 7.293 | 0,00 | 749 | -9,11 | ||||
| 2026-02-11 | 13F | Prudential Plc | 1.751.095 | 12,47 | 198.557 | -3,51 | ||||
| 2026-01-05 | 13F | Commons Capital, Llc | 5.600 | 0,00 | 635 | -14,32 | ||||
| 2026-02-10 | 13F | Bank of New York Mellon Corp | 1.488.074 | -14,40 | 168.733 | -26,57 | ||||
| 2026-02-17 | 13F | Persistent Asset Partners Ltd | 16.423 | -24,85 | 1.862 | -35,53 | ||||
| 2026-02-17 | 13F | Advisor Group Holdings, Inc. | Call | 1 | 0,00 | 4 | -20,00 | |||
| 2026-02-14 | 13F | Triata Capital Ltd | 2.557.700 | 0,52 | 290.018 | -13,76 | ||||
| 2026-02-12 | 13F | Penserra Capital Management LLC | 7.509 | -21,54 | 1 | -100,00 | ||||
| 2026-02-17 | 13F | First Beijing Investment Ltd | 6.782.955 | 9,96 | 769.119 | -5,67 | ||||
| 2026-04-14 | 13F | Yarbrough Capital, LLC | 53.202 | 0,00 | 5.436 | -9,88 | ||||
| 2026-01-27 | 13F | WealthCollab, LLC | 73 | 0,00 | 8 | -11,11 | ||||
| 2026-02-17 | 13F | EFG International AG | 12.013 | 1.362 | ||||||
| 2026-02-13 | 13F | Caitong International Asset Management Co., Ltd | 67 | 8 | ||||||
| 2026-02-10 | 13F | Eurizon Capital SGR S.p.A. | 96.606 | 10.954 | ||||||
| 2025-11-03 | 13F | Truist Financial Corp | 0 | -100,00 | 0 | |||||
| 2026-04-24 | 13F | UMA Financial Services, Inc. | 39 | -40,00 | 4 | -57,14 | ||||
| 2026-02-03 | 13F | NewEdge Wealth, LLC | 15.583 | 3,56 | 1.767 | -13,90 | ||||
| 2026-02-11 | 13F | Ing Groep Nv | 3.887 | -2,61 | 441 | -16,51 | ||||
| 2026-04-15 | 13F | Myriad Asset Management US LP | 0 | -100,00 | 0 | |||||
| 2026-01-07 | 13F | Sagespring Wealth Partners, Llc | 3.457 | -5,16 | 392 | -18,50 | ||||
| 2026-02-13 | 13F | NLB Skladi, upravljanje premozenja, d.o.o. | 16.349 | 1.854 | ||||||
| 2026-02-17 | 13F | Bracebridge Capital, LLC | 9.000 | 1.021 | ||||||
| 2026-02-17 | 13F | Bracebridge Capital, LLC | Call | 193 | 2.188 | |||||
| 2026-02-17 | 13F | Bracebridge Capital, LLC | Put | 193 | 2.188 | |||||
| 2026-04-16 | 13F | BI Asset Management Fondsmaeglerselskab A/S | 211.209 | -4,48 | 22 | -16,00 | ||||
| 2026-02-13 | 13F | Rafferty Asset Management, LLC | 112.024 | 18,47 | 12.702 | 1,63 | ||||
| 2026-02-13 | 13F | Platinum Investment Management Ltd | 78.445 | -11,37 | 8.895 | -23,97 | ||||
| 2026-02-10 | 13F | IFG Advisory, LLC | 0 | -100,00 | 0 | |||||
| 2026-04-24 | 13F | LB Partners LLC | 22.000 | 2.248 | ||||||
| 2026-01-23 | 13F | Sumitomo Mitsui Trust Holdings, Inc. | 1.682.194 | -2,17 | 190.744 | -16,07 | ||||
| 2026-02-12 | 13F | Ensign Peak Advisors, Inc | 36.200 | 0,00 | 4.105 | -14,21 | ||||
| 2026-02-11 | 13F | Jpmorgan Chase & Co | 5.068.738 | -9,19 | 574.744 | -22,10 | ||||
| 2026-02-11 | 13F | Jpmorgan Chase & Co | Call | 639.600 | 10,62 | 72.524 | -5,10 | |||
| 2026-02-11 | 13F | Jpmorgan Chase & Co | Put | 577.900 | 12,28 | 65.528 | -3,67 | |||
| 2026-02-12 | 13F | Wealthspire Advisors, LLC | 0 | -100,00 | 0 | |||||
| 2026-01-06 | 13F | E Six Thirteen, Llc | 8.059 | -0,24 | 914 | -14,43 | ||||
| 2026-01-23 | 13F | Steigerwald, Gordon & Koch Inc. | 11 | 1 | ||||||
| 2025-11-13 | 13F | Eisler Capital Management Ltd. | 4.071 | -84,65 | 537 | -80,68 | ||||
| 2025-11-13 | 13F | Eisler Capital Management Ltd. | Call | 219.400 | 30,91 | 28.939 | 64,95 | |||
| 2026-04-15 | 13F | Compagnie Lombard Odier SCmA | 6.200 | 396,00 | 634 | 348,94 | ||||
| 2025-11-13 | 13F | Eisler Capital Management Ltd. | Put | 533.300 | 142,63 | 70.342 | 205,73 | |||
| 2026-01-28 | 13F | Legacy Capital Group California, Inc. | 3.092 | 351 | ||||||
| 2026-02-17 | 13F | Lazard Asset Management Llc | 784.898 | 9,32 | 89.000 | -6,21 | ||||
| 2026-02-04 | 13F | Clark Wealth Partners | 0 | -100,00 | 0 | |||||
| 2026-02-11 | 13F | Capital International Inc /ca/ | 409.537 | 14,66 | 46.437 | -1,63 | ||||
| 2026-04-20 | 13F | Assenagon Asset Management S.A. | 2.193.918 | -67,40 | 224.175 | -70,62 | ||||
| 2026-02-13 | 13F | JustInvest LLC | 17.688 | -1,23 | 2.006 | -15,29 | ||||
| 2026-02-12 | 13F | BRIGHT VALLEY CAPITAL Ltd | 72.600 | 8.232 | ||||||
| 2026-02-10 | 13F | Axq Capital, Lp | 0 | -100,00 | 0 | |||||
| 2026-02-17 | 13F | Nissay Asset Management Corp /japan/ /adv | 107.767 | 8,19 | 12.220 | -7,18 | ||||
| 2026-02-04 | 13F | Pacer Advisors, Inc. | 0 | -100,00 | 0 | |||||
| 2026-04-21 | 13F | Sicart Associates LLC | 11.631 | 0,00 | 1.188 | -9,86 | ||||
| 2026-02-06 | 13F | Handelsbanken Fonder AB | 289.419 | 10,39 | 33 | -5,88 | ||||
| 2026-01-28 | 13F | Migdal Insurance & Financial Holdings Ltd. | 1.590 | 0,00 | 0 | |||||
| 2026-02-13 | 13F | Great West Life Assurance Co /can/ | 548.649 | -39,62 | 62 | -47,46 | ||||
| 2026-02-02 | 13F | Varma Mutual Pension Insurance Co | 37.500 | 10,29 | 4.252 | -5,36 | ||||
| 2026-02-23 | 13F | Virtu Financial LLC | 18.338 | 2 | ||||||
| 2026-01-13 | 13F | Stephens Consulting, LLC | 1.000 | 0,00 | 113 | -14,39 | ||||
| 2026-02-12 | 13F | Keel Point, LLC | 3.512 | -17,85 | 398 | -29,56 | ||||
| 2026-02-05 | 13F | Cambridge Investment Research Advisors, Inc. | 7.285 | 277,85 | 1 | |||||
| 2026-02-17 | 13F | Hillhouse Capital Advisors, Ltd. | 10.721.400 | 24,77 | 1.215.700 | 7,05 | ||||
| 2026-02-13 | 13F | Morgan Stanley | 5.948.846 | -16,17 | 674.540 | -28,08 | ||||
| 2026-02-13 | 13F | Charles Schwab Investment Management Inc | 1.249.313 | 4,70 | 141.660 | -10,17 | ||||
| 2025-11-20 | 13F | Maven Securities LTD | Call | 0 | -100,00 | 0 | ||||
| 2026-02-13 | 13F | Cornerstone Financial Management LLC | 25 | 3 | ||||||
| 2026-02-09 | 13F | Wcm Investment Management, Llc | 228.515 | 17,92 | 26.012 | 2,73 | ||||
| 2025-11-14 | 13F | Mangrove Partners | 0 | -100,00 | 0 | |||||
| 2026-02-10 | 13F | Norges Bank | 9.396.292 | 1.065.446 | ||||||
| 2025-11-20 | 13F | Maven Securities LTD | 0 | -100,00 | 0 | |||||
| 2026-02-17 | 13F | Clear Street Markets Llc | 64.117 | 7.270 | ||||||
| 2026-02-17 | 13F | Clear Street Markets Llc | Call | 10.000 | 1.134 | |||||
| 2025-11-20 | 13F | Maven Securities LTD | Put | 0 | -100,00 | 0 | ||||
| 2025-11-14 | 13F | Polymer Capital Management (US) LLC | 0 | -100,00 | 0 | |||||
| 2026-02-17 | 13F | Aqr Capital Management Llc | 0 | -100,00 | 0 | -100,00 | ||||
| 2025-11-17 | 13F | Sender Co & Partners, Inc. | 0 | -100,00 | 0 | |||||
| 2026-02-13 | 13F | Banco Santander, S.A. | 12.766 | -2,24 | 1.448 | -16,16 | ||||
| 2026-04-20 | 13F | Jfs Wealth Advisors, Llc | 97 | -11,01 | 10 | -25,00 | ||||
| 2026-01-30 | 13F | Archer Investment Corp | 17 | 0,00 | 2 | -50,00 | ||||
| 2026-02-09 | 13F | Frazier Financial Advisors, LLC | 4 | 0,00 | 0 | |||||
| 2026-04-24 | 13F | IFM Investors Pty Ltd | 75.408 | 0,54 | 7.705 | 96.212,50 | ||||
| 2026-02-17 | 13F | Two Sigma Securities, Llc | 0 | -100,00 | 0 | |||||
| 2026-02-05 | 13F | Thrivent Financial For Lutherans | 44.491 | 20,83 | 5 | 25,00 | ||||
| 2026-04-16 | 13F | Toth Financial Advisory Corp | 1 | 0,00 | 0 | |||||
| 2026-01-21 | 13F | AMS Capital Ltda | 0 | -100,00 | 0 | |||||
| 2026-01-27 | 13F | CenterStar Asset Management, LLC | Call | 0 | -100,00 | 0 | ||||
| 2026-02-13 | 13F | Avenir Tech Ltd | 1 | 0,00 | 0 | |||||
| 2026-01-27 | 13F | CenterStar Asset Management, LLC | Put | 0 | -100,00 | 0 | ||||
| 2026-01-30 | 13F | Jennison Associates Llc | 213.348 | 24.192 | ||||||
| 2026-02-12 | 13F | Quadrant Capital Group Llc | 21.197 | -0,18 | 2.404 | -14,36 | ||||
| 2026-04-20 | 13F | Arta Finance Wealth Management LLC | 2.970 | 2,73 | 303 | -7,34 | ||||
| 2025-11-13 | 13F | LGT Group Foundation | 0 | -100,00 | 0 | |||||
| 2026-02-10 | 13F | Eurizon SLJ Capital Ltd | 5.139 | 583 | ||||||
| 2026-02-17 | 13F | Brevan Howard Capital Management LP | Put | 96.000 | -76,95 | 174.167 | -80,28 | |||
| 2026-02-17 | 13F | Anatole Investment Management Ltd | 837.433 | 94.957 | ||||||
| 2026-02-17 | 13F | Brevan Howard Capital Management LP | Call | 101.000 | -84,51 | 183.238 | -86,74 | |||
| 2026-02-11 | 13F | Franklin Resources Inc | 802.538 | 17,79 | 91.000 | 1,05 | ||||
| 2026-02-14 | 13F | Taikang Asset Management (Hong Kong) Co Ltd | 95.665 | 7,12 | 10.847 | -8,10 | ||||
| 2026-02-17 | 13F | Millennium Management Llc | Call | 441.600 | -20,03 | 50.073 | -31,39 | |||
| 2026-02-13 | 13F | Van Eck Associates Corp | 36.560 | -12,41 | 4 | -20,00 | ||||
| 2026-02-17 | 13F | Millennium Management Llc | Put | 1.501.000 | 98,52 | 170.198 | 70,31 | |||
| 2025-11-14 | 13F | Flow Traders U.s. Llc | 0 | -100,00 | 0 | |||||
| 2026-02-17 | 13F | Millennium Management Llc | 382.550 | 132,90 | 43.377 | 99,81 | ||||
| 2025-11-14 | 13F | Axa S.a. | 0 | -100,00 | 0 | -100,00 | ||||
| 2026-02-06 | 13F | Leonteq Securities AG | 57.843 | 115,26 | 6.559 | 84,68 | ||||
| 2026-02-03 | 13F | Crossmark Global Holdings, Inc. | 32.859 | 30,25 | 3.726 | 11,73 | ||||
| 2026-02-06 | 13F | Leonteq Securities AG | Put | 50.000 | 5.670 | |||||
| 2026-02-11 | 13F | Fosun International Ltd | 11.038 | 1.252 | ||||||
| 2025-11-14 | 13F | Kamunting Street Capital Management, L.P. | 0 | -100,00 | 0 | -100,00 | ||||
| 2026-02-06 | 13F | Fairtree Asset Management (Pty) Ltd | 10.209 | -29,30 | 1.158 | -39,36 | ||||
| 2026-02-03 | 13F | Sequoia Financial Advisors, LLC | 5.845 | -10,50 | 663 | -23,29 | ||||
| 2026-01-27 | 13F | TD Waterhouse Canada Inc. | 201 | 20.000,00 | 23 | |||||
| 2026-04-20 | 13F | Banque Cantonale Vaudoise | 6.064 | 7,04 | 620 | -3,43 | ||||
| 2026-02-14 | 13F | Frec Markets, Inc. | 2.932 | 333 | ||||||
| 2026-04-13 | 13F | Trust Co | 4 | 0,00 | 0 | |||||
| 2026-04-15 | 13F | Gf Fund Management Co. Ltd. | 830.784 | -18,48 | 84.890 | -26,54 | ||||
| 2026-02-18 | 13F | Cat Rock Capital Management Lp | 445.228 | 0,00 | 50.484 | -14,21 | ||||
| 2026-01-14 | 13F | Exchange Traded Concepts, Llc | Put | 0 | -100,00 | 0 | -100,00 | |||
| 2026-02-17 | 13F | Point72 Asset Management, L.P. | Put | 296.300 | 779,23 | 33.597 | 654,31 | |||
| 2026-02-17 | 13F | Point72 Asset Management, L.P. | Call | 493.800 | 5.326,37 | 55.992 | 4.558,15 | |||
| 2026-02-17 | 13F | Maytus Capital Management, LLC | 0 | -100,00 | 0 | |||||
| 2025-11-14 | 13F | Wolverine Trading, Llc | Call | 921.600 | 17,64 | 120.425 | 46,21 | |||
| 2025-11-14 | 13F | Wolverine Trading, Llc | Put | 582.400 | 38,34 | 76.102 | 71,93 | |||
| 2026-02-05 | 13F | May Hill Capital, LLC | 7.218 | 65,66 | 818 | 42,26 | ||||
| 2026-02-12 | 13F | Cibc World Markets Corp | 32.445 | -31,80 | 3.679 | -26,11 | ||||
| 2026-02-17 | 13F | Maniro Ltd | 18.346 | 2.080 | ||||||
| 2026-02-11 | 13F | Mirae Asset Securities (usa) Inc. | 100.247 | 11.367 | ||||||
| 2026-02-17 | 13F | FIL Ltd | 6.516.042 | -9,65 | 738.854 | -22,49 | ||||
| 2026-02-17 | 13F | H&H International Investment, LLC | 11.536.694 | 34,55 | 1.308.146 | 15,43 | ||||
| 2025-11-14 | 13F | Wolverine Trading, Llc | 31.490 | -63,84 | 4.115 | -55,07 | ||||
| 2026-01-30 | 13F | State of New Jersey Common Pension Fund D | 40.370 | 4.578 | ||||||
| 2026-01-23 | 13F | Bridgewater Advisors Inc. | 2.515 | 3,88 | 266 | -19,64 | ||||
| 2026-02-17 | 13F | Ardsley Advisory Partners Lp | Call | 0 | -100,00 | 0 | ||||
| 2026-01-20 | 13F | Cigna Investments Inc /new | 12.464 | -1,73 | 1 | 0,00 | ||||
| 2025-11-14 | 13F | Brooklands Fund Management Ltd | Call | 0 | -100,00 | 0 | ||||
| 2025-11-13 | 13F | Barometer Capital Management Inc. | 0 | -100,00 | 0 | -100,00 | ||||
| 2026-02-04 | 13F | NAN FUNG TRINITY (HK) Ltd | 108.100 | 0,00 | 12.257 | -14,21 | ||||
| 2026-02-09 | 13F | Genus Capital Management Inc. | 3.795 | 430 | ||||||
| 2026-02-13 | 13F | Ubs Oconnor Llc | 31.107 | -33,53 | 3.527 | -42,97 | ||||
| 2026-02-13 | 13F | Smartleaf Asset Management LLC | 377 | 230,70 | 43 | 200,00 | ||||
| 2026-02-12 | 13F | NetEase, Inc. | 3.555.488 | 0,00 | 403.157 | -14,21 | ||||
| 2026-02-05 | 13F | Central Asset Investments & Management Holdings (HK) Ltd | 14.083 | -63,28 | 1.597 | -68,51 | ||||
| 2026-02-11 | 13F | Cerity Partners LLC | 18.847 | -6,79 | 2.137 | -20,02 | ||||
| 2026-04-16 | 13F | Allegheny Financial Group LTD | 2.395 | -0,70 | 245 | -10,62 | ||||
| 2026-02-17 | 13F | Quadrature Capital Ltd | 50.210 | -78,05 | 5.693 | -81,17 | ||||
| 2026-02-10 | 13F | Goldman Sachs Group Inc | Put | 3.413.600 | 34,36 | 387.068 | 15,27 | |||
| 2026-02-17 | 13F | Man Group plc | 533.660 | 3.510,45 | 60.512 | 2.998,36 | ||||
| 2026-02-17 | 13F | Credit Agricole S A | Call | 50.000 | 0,00 | 5.670 | -14,21 | |||
| 2026-02-10 | 13F | Goldman Sachs Group Inc | 8.826.751 | -12,18 | 1.000.865 | -24,66 | ||||
| 2026-02-17 | 13F | Man Group plc | Put | 5.000 | 8,70 | 567 | -6,75 | |||
| 2026-02-10 | 13F | Goldman Sachs Group Inc | Call | 979.900 | -46,65 | 111.111 | -54,23 | |||
| 2026-02-11 | 13F | 111 Capital | 6.018 | 682 | ||||||
| 2026-02-13 | 13F | Dodge & Cox | 4.439.800 | 503.429 | ||||||
| 2026-02-17 | 13F | Man Group plc | Call | 5.000 | 8,70 | 567 | -6,75 | |||
| 2026-01-26 | 13F | Mirae Asset Global Investments Co., Ltd. | 364.337 | 4,28 | 41.312 | -10,54 | ||||
| 2026-02-17 | 13F | Credit Agricole S A | 239.796 | 32,75 | 27.190 | 13,88 | ||||
| 2026-02-17 | 13F | Credit Agricole S A | Put | 25.000 | 0,00 | 2.835 | -14,23 | |||
| 2026-02-13 | 13F | Marshall Wace, Llp | Call | 9.100 | 1.032 | |||||
| 2026-02-13 | 13F | Marshall Wace, Llp | Put | 17.700 | 2.007 | |||||
| 2026-02-13 | 13F | Aspex Management (HK) Ltd | 3.109.525 | -1,98 | 353 | -15,99 | ||||
| 2026-02-05 | 13F | ANTIPODES PARTNERS Ltd | 98.144 | -3,69 | 11.129 | -17,37 | ||||
| 2026-02-13 | 13F | Marshall Wace, Llp | 4.512.664 | 511.691 | ||||||
| 2026-02-17 | 13F | Russell Investments Group, Ltd. | 1.074.635 | 30,12 | 122.050 | 12,25 | ||||
| 2026-04-22 | 13F | Union Bancaire Privee, UBP SA | 109.760 | 25,83 | 9.810 | 9,76 | ||||
| 2026-02-10 | 13F | Savant Capital, LLC | 2.816 | 7,11 | 319 | -8,07 | ||||
| 2025-12-15 | 13F/A | Hudson Bay Capital Management LP | Call | 0 | -100,00 | 0 | -100,00 | |||
| 2026-02-10 | 13F | Quantbot Technologies LP | 6.773 | 768 | ||||||
| 2026-02-17 | 13F | Bamco Inc /ny/ | 62.386 | 0,00 | 7.074 | -14,21 | ||||
| 2026-02-17 | 13F | Temasek Holdings (Private) Ltd | 4.682.894 | 7,70 | 530.993 | -7,61 | ||||
| 2026-02-10 | 13F | Bnp Paribas | 2.300 | 53,33 | 261 | 31,31 | ||||
| 2026-02-13 | 13F | Toroso Investments, LLC | 96.529 | -3,93 | 10.945 | -17,58 | ||||
| 2026-01-28 | 13F | Oversea-Chinese Banking CORP Ltd | 400.127 | 8,56 | 45.379 | -6,81 | ||||
| 2026-02-11 | 13F | Deutsche Bank Ag\ | 2.776.077 | 2,69 | 314.779 | -11,90 | ||||
| 2025-11-13 | 13F | Total Investment Management Inc | 0 | -100,00 | 0 | |||||
| 2026-02-12 | 13F | Qtron Investments LLC | 0 | -100,00 | 0 | |||||
| 2026-01-16 | 13F | Crewe Advisors LLC | 46 | 0,00 | 5 | -16,67 | ||||
| 2026-02-17 | 13F | Quantitative Investment Management, LLC | 0 | -100,00 | 0 | |||||
| 2026-04-16 | 13F | Franchise GP Ltd | 497.860 | 64,60 | 50.871 | 48,33 | ||||
| 2026-02-17 | 13F | Seldon Capital Lp | 48.226 | -2,53 | 5.468 | -16,38 | ||||
| 2026-02-17 | 13F | Toronto Dominion Bank | 11.225 | -67,38 | 1.273 | -72,03 | ||||
| 2026-01-23 | 13F | U.S. Capital Wealth Advisors, LLC | 0 | -100,00 | 0 | |||||
| 2026-02-13 | 13F | Parkside Financial Bank & Trust | 35 | 0,00 | 4 | -25,00 | ||||
| 2026-02-09 | 13F | Boundless Plain Holdings Ltd | 1.294.753 | 146.812 | ||||||
| 2026-04-24 | 13F | Root Financial Partners, LLC | 63 | 43,18 | 6 | 50,00 | ||||
| 2026-02-17 | 13F | Cederberg Capital Ltd | 755.900 | 0,00 | 100 | 0,00 | ||||
| 2026-02-19 | 13F/A | Headwater Capital Co Ltd | 260.000 | 73,33 | 29.481 | 48,71 | ||||
| 2025-11-12 | 13F | Close Asset Management Ltd | 0 | -100,00 | 0 | |||||
| 2026-02-17 | 13F | SIH Partners, LLLP | 0 | -100,00 | 0 | |||||
| 2025-11-21 | 13F/A | CIBC Bancorp USA Inc. | 24.455 | 3.232 | ||||||
| 2026-02-09 | 13F | Freemont Capital Pte Ltd | 35.000 | 0,00 | 3.969 | -14,21 | ||||
| 2025-11-12 | 13F | Tounjian Advisory Partners, Llc | 0 | -100,00 | 0 | |||||
| 2026-02-10 | 13F | Parametrica Management Ltd | 29.230 | 52,00 | 3.314 | 30,42 | ||||
| 2025-11-14 | 13F | PineBridge Investments, L.P. | 8.830 | 29,28 | 1.167 | 63,45 | ||||
| 2025-11-04 | 13F | High Note Wealth, LLC | 0 | -100,00 | 0 | |||||
| 2026-02-17 | 13F | Veritas Asset Management LLP | 22.506 | 0,00 | 2.552 | -14,22 | ||||
| 2026-02-11 | 13F | RWC Asset Management LLP | 6.390 | 0,00 | 725 | -14,22 | ||||
| 2026-02-17 | 13F | Maple Rock Capital Partners Inc. | 306.641 | -40,91 | 34.770 | -49,31 | ||||
| 2025-11-14 | 13F | Point72 Hong Kong Ltd | 1.577.173 | 215,56 | 208.455 | 298,51 | ||||
| 2026-02-06 | 13F | Investment House Llc | 0 | -100,00 | 0 | |||||
| 2026-02-10 | 13F | Envestnet Asset Management Inc | 13.394 | -28,89 | 1.519 | -39,01 | ||||
| 2026-02-13 | 13F | Schroder Investment Management Group | 4.137.857 | 199,84 | 469.192 | 157,24 | ||||
| 2026-02-17 | 13F | Old Mission Capital Llc | 4.437 | 503 | ||||||
| 2025-11-14 | 13F | Grafton Street Partners Fund, LP | 0 | -100,00 | 0 | -100,00 | ||||
| 2026-02-12 | 13F | Ankerstar Wealth, LLC | 1 | 0 | ||||||
| 2026-02-09 | 13F | Morningstar Investment Management LLC | 3.034 | 0,00 | 0 | |||||
| 2026-02-12 | 13F | APG Asset Management N.V. | 380.428 | 0,77 | 36.729 | -13,51 | ||||
| 2025-11-14 | 13F | Luxor Capital Group, LP | 0 | -100,00 | 0 | |||||
| 2025-11-14 | 13F | Luxor Capital Group, LP | Call | 0 | -100,00 | 0 | ||||
| 2026-02-12 | 13F | Principal Securities, Inc. | 0 | -100,00 | 0 | -100,00 | ||||
| 2026-02-10 | 13F | Hershey Trust Co | 0 | -100,00 | 0 | -100,00 | ||||
| 2026-02-06 | 13F | Resona Asset Management Co.,Ltd. | 179.539 | -4,47 | 20.377 | -17,84 | ||||
| 2026-02-11 | 13F | O'shaughnessy Asset Management, Llc | 53.219 | 3,43 | 6.035 | -11,26 | ||||
| 2026-02-03 | 13F | SBI Securities Co., Ltd. | 2.672 | -2,12 | 303 | -16,11 | ||||
| 2026-02-12 | 13F | Skopos Labs, Inc. | 31.958 | 326,68 | 3.648 | 363,53 | ||||
| 2026-02-17 | 13F | Fullerton Fund Management Co Ltd | 8.179 | 927 | ||||||
| 2026-02-09 | 13F | Arista Wealth Management, LLC | 0 | -100,00 | 0 | |||||
| 2026-02-13 | 13F | Barclays Plc | Call | 679.200 | 14,54 | 77.014 | -1,74 | |||
| 2025-11-13 | 13F | Limestone Investment Advisors LP | Call | 0 | -100,00 | 0 | -100,00 | |||
| 2025-11-13 | 13F | Limestone Investment Advisors LP | Put | 0 | -100,00 | 0 | -100,00 | |||
| 2026-04-21 | 13F | Aaron Wealth Advisors LLC | 10.089 | 154,64 | 1.031 | 129,40 | ||||
| 2026-01-29 | 13F | IMC-Chicago, LLC | 347.618 | 39.416 | ||||||
| 2026-04-15 | 13F | Activest Wealth Management | 350 | 0,00 | 36 | -10,26 | ||||
| 2026-01-29 | 13F | IMC-Chicago, LLC | Put | 3.015.700 | 7,02 | 341.950 | -8,18 | |||
| 2026-01-29 | 13F | IMC-Chicago, LLC | Call | 3.531.100 | -46,57 | 400.391 | -54,16 | |||
| 2026-02-13 | 13F | Ubs Asset Management Americas Inc | 392 | 44 | ||||||
| 2026-01-30 | 13F | ABS Direct Equity Fund LLC | 57.530 | 33,69 | 6.523 | 14,70 | ||||
| 2026-02-02 | 13F | Danske Bank A/s | 109.112 | 1,30 | 12.372 | -13,09 | ||||
| 2026-02-18 | 13F | Mackenzie Financial Corp | 421.758 | 13,56 | 47.914 | -2,39 | ||||
| 2026-02-02 | 13F | Robertson Stephens Wealth Management, LLC | 4.000 | 0,00 | 454 | -14,20 | ||||
| 2026-02-13 | 13F | Barclays Plc | 2.660.115 | 57,80 | 301.630 | 35,38 | ||||
| 2026-02-13 | 13F | Barclays Plc | Put | 1.340.000 | 81,55 | 151.943 | 55,75 | |||
| 2025-11-04 | 13F | Twenty Acre Capital LP | 0 | -100,00 | 0 | -100,00 | ||||
| 2026-02-13 | 13F | Fortis Capital Management LLC | 0 | -100,00 | 0 | |||||
| 2026-02-17 | 13F | Guggenheim Capital Llc | 159.549 | 3,00 | 18.091 | -11,63 | ||||
| 2026-03-20 | 13F/A | Hsbc Holdings Plc | 4.669.352 | -44,46 | 531.078 | -52,10 | ||||
| 2026-04-20 | 13F | Ronald Blue Trust, Inc. | 3.410 | -2,60 | 348 | -12,12 | ||||
| 2026-03-20 | 13F/A | Hsbc Holdings Plc | Put | 128.700 | -96,71 | 14.601 | -97,15 | |||
| 2026-03-20 | 13F/A | Hsbc Holdings Plc | Call | 67.000 | 7.601 | |||||
| 2026-02-12 | 13F | Insigneo Advisory Services, Llc | 3.708 | 7,17 | 420 | -8,10 | ||||
| 2026-02-17 | 13F | Jones Financial Companies Lllp | 1.832 | 39,95 | 208 | 21,76 | ||||
| 2026-04-13 | 13F | E Fund Management Co., Ltd. | 4.593.053 | 34,94 | 469.318 | 31,74 | ||||
| 2026-02-09 | 13F | Huntington National Bank | 593 | 25,37 | 67 | 8,06 | ||||
| 2026-04-24 | 13F | Severin Investments, LLC | 0 | -100,00 | 0 | |||||
| 2026-01-15 | 13F | Allspring Global Investments Holdings, LLC | 556.693 | 4.697,01 | 64.437 | 4.033,23 | ||||
| 2026-02-17 | 13F | Hilltop Holdings Inc. | 5.504 | 624 | ||||||
| 2026-02-11 | 13F | Modus Advisors, LLC | 50 | 6 | ||||||
| 2026-02-17 | 13F | Comprehensive Financial Management LLC | 7.789 | -4,35 | 883 | -17,94 | ||||
| 2026-01-28 | 13F | DekaBank Deutsche Girozentrale | 408.010 | 0,00 | 83 | 54,72 | ||||
| 2026-02-10 | 13F | Lido Advisors, LLC | 1.638 | 0,00 | 214 | -1,39 | ||||
| 2026-02-11 | 13F | Capital Analysts, Inc. | 60 | -29,41 | 0 | |||||
| 2026-02-12 | 13F | BRYN MAWR TRUST Co | 0 | -100,00 | 0 | -100,00 | ||||
| 2026-01-23 | 13F | Westside Investment Management, Inc. | 458 | 2,23 | 53 | -13,33 | ||||
| 2026-02-03 | 13F | Virtus Family Office LLC | 37.134 | 1,32 | 4.211 | -13,09 | ||||
| 2026-04-22 | 13F | Janney Montgomery Scott LLC | 66.375 | 7 | ||||||
| 2026-02-13 | 13F | Dynamic Technology Lab Private Ltd | 0 | -100,00 | 0 | |||||
| 2025-11-14 | 13F | KEYWISE CAPITAL MANAGEMENT (HK) Ltd | Call | 0 | -100,00 | 0 | -100,00 | |||
| 2026-04-16 | 13F | SG Americas Securities, LLC | Call | 69.200 | -74,97 | 0 | -100,00 | |||
| 2026-02-03 | 13F | Mitsubishi UFJ Kokusai Asset Management Co., Ltd. | 860.912 | 5,25 | 99.651 | -7,82 | ||||
| 2026-02-09 | 13F | New Age Alpha Advisors, LLC | 35 | 0,00 | 4 | -25,00 | ||||
| 2026-02-17 | 13F | Himension Fund | 127.812 | 15,19 | 14.493 | -1,17 | ||||
| 2026-04-15 | 13F | Merit Financial Group, LLC | 5.377 | -22,48 | 549 | -30,15 | ||||
| 2026-02-12 | 13F | Marex Group plc | 199.627 | -14,31 | 22.636 | -26,49 | ||||
| 2026-02-13 | 13F | Walleye Trading LLC | 885.812 | 100.442 | ||||||
| 2026-04-23 | 13F | iA Global Asset Management Inc. | 85.201 | -6,02 | 9 | -20,00 | ||||
| 2026-02-13 | 13F | Walleye Trading LLC | Put | 3.432.200 | -21,05 | 389.177 | -32,27 | |||
| 2026-02-13 | 13F | Walleye Trading LLC | Call | 1.893.100 | -20,30 | 214.659 | -31,62 | |||
| 2026-02-13 | 13F | Centiva Capital, LP | Call | 629.800 | 989,62 | 71.413 | 834,85 | |||
| 2026-02-13 | 13F | Centiva Capital, LP | 400.000 | 96,86 | 45.356 | 68,89 | ||||
| 2026-02-13 | 13F | Centiva Capital, LP | Put | 2.216.500 | 58,40 | 251.329 | 35,89 | |||
| 2026-04-24 | 13F | Sumitomo Mitsui DS Asset Management Company, Ltd | 46.847 | 2,19 | 4.787 | -7,93 | ||||
| 2026-02-11 | 13F | Allianz Asset Management GmbH | 691.141 | 27,33 | 78.368 | 9,24 | ||||
| 2026-01-28 | 13F | Geneos Wealth Management Inc. | 0 | -100,00 | 0 | |||||
| 2026-02-13 | 13F | Sei Investments Co | 449.686 | 72,68 | 50.990 | 48,14 | ||||
| 2026-02-17 | 13F | Bayesian Capital Management, LP | 0 | -100,00 | 0 | |||||
| 2026-02-17 | 13F | Banco Bilbao Vizcaya Argentaria, S.a. | 0 | -100,00 | 0 | |||||
| 2026-02-17 | 13F | Citadel Advisors Llc | Call | 4.666.200 | -20,10 | 529.100 | -31,45 | |||
| 2026-02-17 | 13F | Citadel Advisors Llc | 315.262 | -76,54 | 35.748 | -79,88 | ||||
| 2026-02-17 | 13F | Citadel Advisors Llc | Put | 3.336.800 | -18,01 | 378.360 | -29,66 | |||
| 2026-02-17 | 13F | Woodline Partners LP | 0 | -100,00 | 0 | |||||
| 2026-04-06 | 13F | GAMMA Investing LLC | 599 | 115,47 | 61 | 96,77 | ||||
| 2026-02-17 | 13F | Boothbay Fund Management, Llc | 16.081 | 38,02 | 1.823 | 18,45 | ||||
| 2026-02-10 | 13F | Commonwealth Of Pennsylvania Public School Empls Retrmt Sys | 58.117 | 0,00 | 6.590 | -14,22 | ||||
| 2026-01-22 | 13F | Massachusetts Financial Services Co /ma/ | 1.259.912 | 1,23 | 142.861 | -13,15 | ||||
| 2026-02-10 | 13F/A | Northwestern Mutual Wealth Management Co | 17.704 | 21,03 | 2.007 | 3,83 | ||||
| 2026-01-15 | 13F | Gunderson Capital Management Inc. | 0 | -100,00 | 0 | |||||
| 2026-02-10 | 13F | National Pension Service | 196.838 | 9,68 | 22.319 | -5,90 | ||||
| 2026-02-12 | 13F | Comgest Global Investors S.a.s. | 55.752 | -1,34 | 6.322 | -15,36 | ||||
| 2026-02-17 | 13F | Newlands Management Operations LLC | 0 | -100,00 | 0 | |||||
| 2026-02-17 | 13F | Caption Management, LLC | 0 | -100,00 | 0 | |||||
| 2026-02-17 | 13F | Caption Management, LLC | Put | 0 | -100,00 | 0 | ||||
| 2026-02-12 | 13F | Nipun Capital, L.P. | 28.000 | 65,68 | 3.175 | 39,33 | ||||
| 2026-02-13 | 13F | Capula Management Ltd | Put | 177.800 | 315,42 | 20.161 | 256,44 | |||
| 2026-01-07 | 13F | Aventura Private Wealth, LLC | 0 | -100,00 | 0 | |||||
| 2026-02-13 | 13F | Capula Management Ltd | Call | 27.400 | -35,38 | 3.107 | -44,58 | |||
| 2026-02-13 | 13F | Rhumbline Advisers | 72.766 | -4,51 | 8.251 | -18,08 | ||||
| 2025-11-06 | 13F | Leading Securities Co Ltd | 0 | -100,00 | 0 | -100,00 | ||||
| 2026-02-13 | 13F | Victory Capital Management Inc | 333.281 | 2,13 | 37.791 | -12,38 | ||||
| 2026-02-13 | 13F | Capula Management Ltd | 34.442 | 3.344,20 | 3.905 | 2.858,33 | ||||
| 2026-02-10 | 13F | Texas Yale Capital Corp. | 11.728 | -23,66 | 1.330 | -34,53 | ||||
| 2026-02-06 | 13F | EverSource Wealth Advisors, LLC | 1.547 | -15,56 | 175 | -27,69 | ||||
| 2026-02-13 | 13F | Healthcare Of Ontario Pension Plan Trust Fund | 710.731 | 36,42 | 80.590 | 17,04 | ||||
| 2025-11-12 | 13F | Anfield Capital Management, LLC | 0 | -100,00 | 0 | |||||
| 2026-02-17 | 13F | Creative Planning | 44.609 | -9,75 | 5.058 | -22,57 | ||||
| 2026-02-13 | 13F | Walleye Capital LLC | Call | 161.800 | 789,01 | 18.347 | 662,83 | |||
| 2026-02-13 | 13F | Walleye Capital LLC | Put | 151.400 | 100,53 | 17.167 | 72,05 | |||
| 2026-02-13 | 13F | Walleye Capital LLC | 73.216 | -47,36 | 8.302 | -54,84 | ||||
| 2026-02-17 | 13F | Dragoneer Investment Group, LLC | 1.835.428 | 0,00 | 208.119 | -14,21 | ||||
| 2025-11-14 | 13F | AXA Investment Managers S.A. | 198.948 | 26.295 | ||||||
| 2026-04-13 | 13F | Mather Group, Llc. | 97 | 10 | ||||||
| 2026-04-22 | 13F | Spire Wealth Management | 21 | 0,00 | 2 | 0,00 | ||||
| 2026-02-23 | 13F | Beaird Harris Wealth Management, LLC | 1 | -83,33 | 0 | |||||
| 2026-01-29 | 13F | WT Asset Management Ltd | 0 | -100,00 | 0 | |||||
| 2025-10-31 | 13F | Aegon Asset Management Uk Plc | 0 | -100,00 | 0 | -100,00 | ||||
| 2026-02-13 | 13F | Alberta Investment Management Corp | 11.300 | -34,68 | 1.281 | -43,96 | ||||
| 2026-02-13 | 13F | Solstein Capital, LLC | 14.233 | -3,17 | 1.614 | -16,94 | ||||
| 2026-01-30 | 13F | RV Capital GmbH | 0 | -100,00 | 0 | |||||
| 2026-02-13 | 13F | Public Sector Pension Investment Board | 414.330 | 0,58 | 46.981 | -13,71 | ||||
| 2026-02-17 | 13F | Jump Financial, LLC | 3.659 | -81,41 | 415 | -84,08 | ||||
| 2026-02-06 | 13F | Pnc Financial Services Group, Inc. | 6.211 | -5,85 | 704 | -19,17 | ||||
| 2026-02-17 | 13F | Punch Card Management L.P. | 415.004 | 0,00 | 47.057 | -14,21 | ||||
| 2026-04-21 | 13F | PDS Planning, Inc | 3.726 | 29,38 | 381 | 16,56 | ||||
| 2026-02-13 | 13F | Royal London Asset Management Ltd | 696.172 | 1,13 | 78.939 | -13,24 | ||||
| 2025-11-03 | 13F | J. Safra Sarasin Holding AG | 0 | -100,00 | 0 | -100,00 | ||||
| 2026-02-12 | 13F | Integrated Quantitative Investments LLC | 0 | -100,00 | 0 | |||||
| 2026-02-02 | 13F | Sparta 24 Ltd. | 8.371 | 949 | ||||||
| 2026-02-13 | 13F | Neuberger Berman Group LLC | 120.173 | 17,94 | 13.630 | 1,20 | ||||
| 2026-02-13 | 13F | Colony Group, LLC | 13.886 | 1,03 | 1.512 | -16,74 | ||||
| 2026-02-11 | 13F | Mirae Asset Securities (usa) Inc. | Put | 100.247 | 11.339 | |||||
| 2026-02-09 | 13F | Harbour Investments, Inc. | 94 | 1.466,67 | 11 | |||||
| 2026-02-17 | 13F | Laird Norton Trust Company, Llc | 15.852 | 1.797 | ||||||
| 2026-01-16 | 13F | Standard Life Aberdeen plc | 1.013.878 | -17,45 | 114.964 | -28,93 | ||||
| 2026-02-04 | 13F | Pathway Capital Management, Lp | 0 | -100,00 | 0 | |||||
| 2025-12-16 | 13F | Garde Capital, Inc. | 0 | -100,00 | 0 | |||||
| 2026-02-17 | 13F | StepStone Group LP | 5.841 | 562 | ||||||
| 2026-02-17 | 13F | DZ BANK AG Deutsche Zentral Genossenschafts Bank, Frankfurt am Main | 35.837 | -34,29 | 4.064 | -43,63 | ||||
| 2026-01-29 | 13F | Sanctuary Advisors, LLC | 0 | -100,00 | 0 | -100,00 | ||||
| 2026-04-23 | 13F | American National Bank | 0 | -100,00 | 0 | |||||
| 2026-02-12 | 13F | Commonwealth Equity Services, Llc | 3.913 | -17,04 | 444 | |||||
| 2026-02-06 | 13F | Greenwoods Asset Management Hong Kong Ltd. | 3.968.270 | 18,21 | 449.962 | 1,41 | ||||
| 2026-02-10 | 13F | Jupiter Asset Management Ltd | 180.704 | 721,38 | 20.490 | 604,85 | ||||
| 2026-02-11 | 13F | Winton Capital Group Ltd | 2.700 | 306 | ||||||
| 2026-02-12 | 13F | Alps Advisors Inc | 29.033 | -3,22 | 3.292 | -16,95 | ||||
| 2025-11-20 | 13F | First Affirmative Financial Network | 2.362 | 10,84 | 312 | 39,91 | ||||
| 2026-02-10 | 13F | CIBC Asset Management Inc | 150.924 | 6,20 | 17.113 | -8,89 | ||||
| 2026-02-11 | 13F | Empowered Funds, LLC | 18.231 | 2.067 | ||||||
| 2025-11-13 | 13F | Aware Super Pty Ltd as trustee of Aware Super | 73.243 | 0,00 | 9.681 | 26,29 | ||||
| 2026-02-03 | 13F | AnglePoint Asset Management Ltd | 513.112 | 74,14 | 58.182 | 49,40 | ||||
| 2026-01-29 | 13F | Resonant Capital Advisors, LLC | 0 | -100,00 | 0 | |||||
| 2026-02-17 | 13F | Tudor Investment Corp Et Al | Put | 274.500 | 31.126 | |||||
| 2026-02-17 | 13F | Tudor Investment Corp Et Al | 151.348 | 14,86 | 17.161 | -1,46 | ||||
| 2026-02-17 | 13F | Tudor Investment Corp Et Al | Call | 112.000 | 12.700 | |||||
| 2026-02-05 | 13F | Bessemer Group Inc | 106 | 0,00 | 0 | |||||
| 2026-02-10 | 13F | State of Wyoming | 9.280 | -3,53 | 1.052 | -17,23 | ||||
| 2026-02-13 | 13F | Dymon Asia Capital (singapore) Pte. Ltd. | 0 | -100,00 | 0 | |||||
| 2026-02-17 | 13F | Susquehanna International Group, Llp | Put | 7.685.600 | -24,51 | 871.470 | -35,24 | |||
| 2026-02-17 | 13F | Susquehanna International Group, Llp | Call | 7.496.700 | -57,30 | 850.051 | -63,37 | |||
| 2026-02-17 | 13F | Advisor Group Holdings, Inc. | 8.530 | -20,55 | 967 | -28,74 | ||||
| 2026-02-17 | 13F | Susquehanna International Group, Llp | 666.594 | -79,42 | 75.585 | -82,35 | ||||
| 2026-02-09 | 13F | Todd Asset Management Llc | 312.283 | -1,93 | 35.411 | -15,87 | ||||
| 2026-04-24 | 13F | Strs Ohio | 9.018 | -78,47 | 921 | -80,61 | ||||
| 2026-04-24 | 13F | Yousif Capital Management, Llc | 18.501 | 0,00 | 1.890 | -2,17 | ||||
| 2026-02-12 | 13F | Aviva Plc | 641.018 | -1,75 | 72.685 | -15,71 | ||||
| 2026-02-13 | 13F | Police & Firemen's Retirement System of New Jersey | 83.999 | -0,97 | 9.525 | -15,05 | ||||
| 2026-02-10 | 13F | Connor, Clark & Lunn Investment Management Ltd. | 216.765 | -27,50 | 24.579 | -37,81 | ||||
| 2026-04-14 | 13F | Clean Yield Group | 26 | 0,00 | 3 | 0,00 | ||||
| 2026-02-11 | 13F | Capital International Sarl | 27.738 | 7,49 | 3.145 | -7,77 | ||||
| 2026-02-06 | 13F | Carrhae Capital LLP | 222.654 | -42,46 | 25.247 | -50,63 | ||||
| 2026-02-13 | 13F | Bank Of Nova Scotia | 16.662 | 645,50 | 1.889 | 540,34 | ||||
| 2026-02-04 | 13F | Plato Investment Management Ltd | 1.940 | 0,00 | 221 | -12,99 | ||||
| 2026-02-02 | 13F | MN Wealth Advisors, LLC | 0 | -100,00 | 0 | |||||
| 2026-02-13 | 13F | Bank Of Nova Scotia | Put | 381 | 0,00 | 43 | -14,00 | |||
| 2026-02-05 | 13F | Elyxium Wealth, LLC | 43 | 5 | ||||||
| 2026-02-05 | 13F | STF Management LP | 3.392 | -49,35 | 385 | -56,61 | ||||
| 2026-01-15 | 13F | Range Financial Group LLC | 3.620 | 3,75 | 410 | -11,06 | ||||
| 2026-02-12 | 13F | Banco BTG Pactual S.A. | 68.967 | 135,13 | 7.820 | 101,75 | ||||
| 2025-11-07 | 13F | Sierra Ocean, Llc | 0 | -100,00 | 0 | |||||
| 2026-02-13 | 13F | Pinnacle Wealth Planning Services, Inc. | 1.190 | 135 | ||||||
| 2026-04-16 | 13F | SG Americas Securities, LLC | 6.301.820 | 94,61 | 644 | 75,20 | ||||
| 2026-02-17 | 13F | Saba Capital Management, L.P. | 36.318 | 64,05 | 4.118 | 40,74 | ||||
| 2026-02-17 | 13F | Saba Capital Management, L.P. | Put | 85.800 | 0,00 | 9.729 | -14,22 | |||
| 2026-02-03 | 13F | Ballentine Partners, LLC | 3.178 | 14,81 | 360 | -1,37 | ||||
| 2026-02-12 | 13F | Pitcairn Co | 0 | -100,00 | 0 | |||||
| 2026-02-05 | 13F | Baader Bank INC | 3.073 | 345 | ||||||
| 2026-02-05 | 13F | Baader Bank INC | Call | 200.000 | 22.678 | |||||
| 2025-11-14 | 13F | Sylebra Capital Llc | 0 | -100,00 | 0 | |||||
| 2026-02-13 | 13F | Allianz Se | 0 | -100,00 | 0 | |||||
| 2026-02-17 | 13F | Appaloosa Lp | 1.775.000 | -1,39 | 201.267 | -15,40 | ||||
| 2026-02-17 | 13F | Rakuten Investment Management, Inc. | 62.688 | -54,75 | 7.156 | -51,98 | ||||
| 2026-02-12 | 13F | Triumph Capital Management | 6 | 1 | ||||||
| 2026-02-13 | 13F | Siren, L.L.C. | 63.401 | 46,08 | 7.189 | 25,33 | ||||
| 2026-02-17 | 13F | Redwood Investment Management, Llc | 7.647 | 1 | ||||||
| 2026-02-19 | 13F | Invesco Ltd. | 6.159.608 | 16,70 | 698.438 | 0,12 | ||||
| 2026-02-13 | 13F | Global Endowment Management, LP | 6.358 | -24,82 | 721 | -35,45 | ||||
| 2026-01-29 | 13F | Polaris Capital Management, LLC | 5.700 | 646 | ||||||
| 2026-02-02 | 13F | Fifth Third Bancorp | 3.649 | 4,32 | 414 | -10,61 | ||||
| 2026-02-20 | 13F/A | CMT Capital Markets Trading GmbH | 63.508 | 5,96 | 7 | 0,00 | ||||
| 2026-02-18 | 13F | Ctc Llc | Call | 51 | -17,74 | 578 | -29,43 | |||
| 2026-02-17 | 13F | Sig Brokerage, Lp | Call | 63.000 | 0,00 | 7.144 | -14,21 | |||
| 2026-02-12 | 13F | Swiss National Bank | 1.552.644 | -2,99 | 176.054 | -16,77 | ||||
| 2025-11-14 | 13F | Sig Brokerage, Lp | 0 | -100,00 | 0 | -100,00 | ||||
| 2026-02-18 | 13F | Ctc Llc | Put | 45 | -45,12 | 510 | -52,91 | |||
| 2026-02-17 | 13F | CastleKnight Management LP | 56.700 | 0,00 | 6.429 | -14,21 | ||||
| 2025-11-03 | 13F | Valeo Financial Advisors, LLC | 0 | -100,00 | 0 | -100,00 | ||||
| 2026-02-17 | 13F | Agf Management Ltd | 2.030 | 0,00 | 230 | -14,18 | ||||
| 2026-02-12 | 13F | Alpha Family Trust | 2.815 | 0,00 | 319 | -14,25 | ||||
| 2026-02-12 | 13F | Sustainable Insight Capital Management, LLC | 2.938 | 20,51 | 333 | 3,42 | ||||
| 2026-03-10 | 13F | MY.Alpha Management HK Advisors Ltd | 145.263 | 16.471 | ||||||
| 2026-02-10 | 13F | Td Asset Management Inc | 86.650 | -11,42 | 9.825 | -24,00 | ||||
| 2026-02-13 | 13F | IDG China Venture Capital Fund IV Associates L.P. | 1.749.029 | -12,46 | 198.322 | -24,90 | ||||
| 2025-11-12 | 13F | Group One Trading, L.p. | 0 | -100,00 | 0 | -100,00 | ||||
| 2026-01-22 | 13F | BOCHK Asset Management Ltd | 200 | -97,33 | 23 | -97,78 | ||||
| 2026-02-06 | 13F | ProShare Advisors LLC | 1.056.004 | 41,54 | 119.740 | 21,43 | ||||
| 2026-02-17 | 13F | Price T Rowe Associates Inc /md/ | 3.262.954 | -39,24 | 370 | -47,95 | ||||
| 2026-01-27 | 13F | Asset Management One Co., Ltd. | 118.509 | -5,12 | 13.528 | -18,06 | ||||
| 2026-02-03 | 13F | Ethic Inc. | 2.586 | 4,40 | 293 | -10,40 | ||||
| 2026-02-03 | 13F | Encompass More Asset Management | 3.168 | 359 | ||||||
| 2026-02-13 | 13F | Ossiam | 0 | -100,00 | 0 | -100,00 | ||||
| 2026-02-10 | 13F | Yunqi Capital Ltd | 185.100 | 27,83 | 20.988 | 9,67 | ||||
| 2026-01-29 | 13F | Sava Infond d.o.o. | 9.400 | 13,25 | 1.066 | -2,92 | ||||
| 2026-02-17 | 13F | Johns Hopkins University | 0 | -100,00 | 0 | -100,00 | ||||
| 2026-02-13 | 13F | MAI Capital Management | 22 | -74,12 | 2 | -81,82 | ||||
| 2026-02-03 | 13F | Credit Industriel Et Commercial | Put | 30.200 | 0,00 | 3.424 | -14,21 | |||
| 2026-02-03 | 13F | Credit Industriel Et Commercial | 10.849 | 181,65 | 1.230 | 141,65 | ||||
| 2026-02-06 | 13F | Gsa Capital Partners Llp | 20.700 | 353,35 | 2 | |||||
| 2026-02-13 | 13F | OMERS ADMINISTRATION Corp | 27.805 | 292,89 | 3.153 | 237,11 | ||||
| 2026-02-13 | 13F | State Street Corp | 12.257.360 | 1,27 | 1.389.862 | -13,12 | ||||
| 2026-02-12 | 13F | Northwest & Ethical Investments L.P. | 0 | -100,00 | 0 | |||||
| 2026-04-06 | 13F | Versant Capital Management, Inc | 22 | 2 | ||||||
| 2026-02-13 | 13F | Mml Investors Services, Llc | 3.882 | 98,87 | 440 | 71,21 | ||||
| 2026-02-17 | 13F | Northern Trust Corp | 3.189.599 | -0,74 | 361.669 | -14,84 | ||||
| 2026-02-12 | 13F | Bank of Jackson Hole Trust | 22 | 2 | ||||||
| 2026-02-17 | 13F | Fmr Llc | 14.597.758 | -15,72 | 1.655.240 | -27,69 | ||||
| 2026-02-17 | 13F | Engineers Gate Manager LP | 21.056 | 2.388 | ||||||
| 2026-04-16 | 13F | SG Americas Securities, LLC | Put | 96.800 | -60,03 | 0 | ||||
| 2026-04-23 | 13F | North Star Investment Management Corp. | 57 | 67,65 | 6 | 66,67 | ||||
| 2026-02-12 | 13F | Rossby Financial, LCC | 3 | 0,00 | 0 | |||||
| 2026-01-15 | 13F | Nisa Investment Advisors, Llc | 315 | 5,00 | 36 | -10,26 | ||||
| 2026-01-29 | 13F | Teachers Retirement System Of The State Of Kentucky | 210.660 | -1,50 | 24 | -17,86 | ||||
| 2025-10-28 | 13F | Wolverine Asset Management Llc | Call | 0 | -100,00 | 0 | -100,00 | |||
| 2026-01-26 | 13F | AE Wealth Management LLC | 17.900 | 47,87 | 2.030 | 26,89 | ||||
| 2026-02-17 | 13F | Private Advisor Group, LLC | 13.619 | -15,06 | 1.544 | -27,14 | ||||
| 2025-11-12 | 13F | Accuvest Global Advisors | 2.140 | -4,59 | 283 | 20,43 | ||||
| 2026-02-02 | 13F | Horizon Investments, LLC | 20.717 | 62,26 | 2.349 | 39,24 | ||||
| 2026-02-09 | 13F | Legal & General Group Plc | 4.147.464 | -8,35 | 470.280 | -21,38 | ||||
| 2026-02-10 | 13F | PARUS FINANCE (UK) Ltd | 112.506 | -38,68 | 12.757 | -47,39 | ||||
| 2026-02-12 | 13F | Advisors Asset Management, Inc. | 3.568 | -15,19 | 405 | -27,34 | ||||
| 2026-04-24 | 13F | USS Investment Management Ltd | 697.636 | 86,00 | 71.295 | 67,69 | ||||
| 2026-02-23 | 13F | Copos Capital S.a r.l. | 78.300 | 8.878 | ||||||
| 2026-02-20 | 13F/A | Capital Markets Trading UK LLP | 3.250 | 0 | ||||||
| 2026-02-13 | 13F | Hel Ved Capital Management Ltd | 38.637 | 0,52 | 4.381 | -13,76 | ||||
| 2026-02-17 | 13F | Signature Equity Partners, LLC | 18 | 2 | ||||||
| 2025-10-28 | 13F | Franchise Capital Ltd | 501.460 | -0,12 | 66.278 | 26,14 | ||||
| 2026-02-12 | 13F | Hrt Financial Lp | 0 | -100,00 | 0 | |||||
| 2025-11-14 | 13F | Capstone Investment Advisors, Llc | Call | 19.500 | -22,31 | 2.577 | -1,87 | |||
| 2026-02-10 | 13F | NINE MASTS CAPITAL Ltd | 6.586 | 747 | ||||||
| 2025-11-14 | 13F | Capstone Investment Advisors, Llc | 3.175 | -23,20 | 420 | -3,01 | ||||
| 2026-04-06 | 13F | Highline Wealth Partners Llc | 66 | -50,38 | 7 | -60,00 | ||||
| 2026-02-17 | 13F | united american securities inc. (d/b/a uas asset management) | 15.000 | 20,00 | 1.701 | 2,91 | ||||
| 2026-01-27 | 13F | Checchi Capital Advisers, LLC | 3.842 | -5,02 | 436 | -18,54 | ||||
| 2026-02-13 | 13F | Squarepoint Ops LLC | Call | 93.900 | -82,96 | 10.647 | -85,39 | |||
| 2026-02-13 | 13F | Squarepoint Ops LLC | Put | 472.900 | -82,23 | 53.622 | -84,75 | |||
| 2026-02-13 | 13F | Squarepoint Ops LLC | 3.910 | -99,00 | 443 | -99,14 | ||||
| 2026-02-13 | 13F | Quarry LP | 57 | 111,11 | 6 | 100,00 | ||||
| 2026-02-13 | 13F | Umb Bank N A/mo | 232 | 36,47 | 26 | 18,18 | ||||
| 2026-04-21 | 13F | Nemes Rush Group LLC | 17 | 0,00 | 2 | 0,00 | ||||
| 2025-11-14 | 13F | Cubist Systematic Strategies, LLC | Put | 359.500 | 20,56 | 47.515 | 52,25 | |||
| 2025-11-14 | 13F | Cubist Systematic Strategies, LLC | Call | 487.500 | 23,86 | 64.433 | 56,41 | |||
| 2026-01-15 | 13F | Frank, Rimerman Advisors LLC | 4.007 | 0,73 | 454 | -13,52 | ||||
| 2026-02-10 | 13F | Intech Investment Management Llc | 23.223 | 14,79 | 2.633 | -1,50 | ||||
| 2026-02-02 | 13F | Principal Financial Group Inc | 6.971 | 790 | ||||||
| 2025-10-28 | 13F | Wolverine Asset Management Llc | Put | 0 | -100,00 | 0 | -100,00 | |||
| 2026-02-11 | 13F | Harvest Fund Management Co., Ltd | 422.263 | 6,60 | 48 | -9,62 | ||||
| 2026-03-31 | 13F | Sankala Group LLC | 1.574 | 25,02 | 160 | 22,31 | ||||
| 2026-04-08 | 13F | E Fund Management (Hong Kong) Co., Ltd. | 279.435 | -4,58 | 28.553 | -5,75 | ||||
| 2026-01-30 | 13F | Mitsubishi UFJ Trust & Banking Corp | 3.167.810 | 25,54 | 359.198 | 7,71 | ||||
| 2026-01-30 | 13F/A | M&t Bank Corp | 18.960 | 2.150 | ||||||
| 2026-04-17 | 13F | AdvisorNet Financial, Inc | 0 | -100,00 | 0 | |||||
| 2026-02-17 | 13F | Balyasny Asset Management Llc | 335.433 | -23,53 | 38.035 | -34,39 | ||||
| 2026-02-17 | 13F | Balyasny Asset Management Llc | Put | 1.177.900 | 32,54 | 133.468 | 13,63 | |||
| 2026-01-30 | 13F | Wealthfront Advisers Llc | 3.482 | 395 | ||||||
| 2026-02-17 | 13F | Balyasny Asset Management Llc | Call | 280.500 | 79,23 | 31.783 | 53,67 | |||
| 2026-02-09 | 13F | Accent Capital Management, LLC | 650 | 0,00 | 74 | -14,12 | ||||
| 2026-02-11 | 13F | Ameritas Investment Partners, Inc. | 24.147 | 2.738 | ||||||
| 2026-02-13 | 13F | Wells Fargo & Company/mn | 135.516 | 5,97 | 15.366 | -9,09 | ||||
| 2026-02-10 | 13F | Mawer Investment Management Ltd. | 34.390 | -0,03 | 3.899 | -14,23 | ||||
| 2026-02-10 | 13F | CIBC World Markets Inc. | 6.615 | 110,87 | 750 | 81,16 | ||||
| 2026-02-13 | 13F | Osmosis Investment Management UK Ltd | 5.573 | 632 | ||||||
| 2026-04-23 | 13F | Lansforsakringar Fondforvaltning AB (publ) | 139.939 | 1,90 | 14.299 | -8,18 | ||||
| 2025-11-13 | 13F | Private Advisor Group, LLC | Put | 0 | -100,00 | 0 | -100,00 | |||
| 2026-01-15 | 13F | Victory Financial Group, Llc | 1.878 | -33,29 | 213 | -43,01 | ||||
| 2026-02-11 | 13F | Simplex Trading, Llc | Call | 2.129.600 | 27,53 | 241.475 | 109.661,36 | |||
| 2026-02-11 | 13F | Simplex Trading, Llc | Put | 1.067.000 | -50,02 | 120.987 | 42.803,19 | |||
| 2026-02-11 | 13F | Simplex Trading, Llc | 14.795 | -96,81 | 1.678 | 2.649,18 | ||||
| 2026-02-17 | 13F | KEYWISE CAPITAL MANAGEMENT (HK) Ltd | 16.500 | -92,49 | 1.871 | -93,56 | ||||
| 2025-11-14 | 13F | Anson Funds Management LP | 0 | -100,00 | 0 | |||||
| 2026-02-04 | 13F | Bailard, Inc. | 5.000 | 0,00 | 567 | -14,24 | ||||
| 2026-02-12 | 13F | Logan Capital Management Inc | 0 | -100,00 | 0 | |||||
| 2026-02-11 | 13F | IMA Wealth, Inc. | 18 | 2 | ||||||
| 2026-02-12 | 13F | Jane Street Group, Llc | 55.066 | -98,82 | 6.244 | -98,99 | ||||
| 2026-02-12 | 13F | Jane Street Group, Llc | Call | 5.924.400 | -51,76 | 671.768 | -58,61 | |||
| 2026-02-13 | 13F | Alpine Investment Management Ltd | 306.198 | 34.720 | ||||||
| 2026-02-12 | 13F | Jane Street Group, Llc | Put | 8.243.000 | -28,78 | 934.674 | -38,90 | |||
| 2026-02-13 | 13F | Alpine Investment Management Ltd | Call | 8.350 | -37,45 | 94.681 | -46,34 | |||
| 2026-04-21 | 13F | Robeco Institutional Asset Management B.V. | 2.492.893 | 39,58 | 254.724 | 25,78 | ||||
| 2026-02-10 | 13F | Gulf International Bank (UK) Ltd | 33.871 | 0,00 | 4 | -25,00 | ||||
| 2026-02-11 | 13F | Janney Capital Management LLC | 62.035 | -6,96 | 7 | -12,50 | ||||
| 2026-01-26 | 13F | La Banque Postale Asset Management SA | 59.000 | 6.690 | ||||||
| 2026-01-21 | 13F | Prime Capital Investment Advisors, LLC | 1.854 | 1,04 | 210 | -13,22 | ||||
| 2026-02-17 | 13F | Ardmore Road Asset Management LP | 0 | -100,00 | 0 | |||||
| 2026-02-06 | 13F | Capstone Capital Management Ltd | 22.530 | 2.555 | ||||||
| 2026-01-26 | 13F | Asset Dedication, LLC | 5 | 0,00 | 1 | |||||
| 2026-02-05 | 13F | DnB Asset Management AS | 66.782 | 13,00 | 7.572 | -3,06 | ||||
| 2026-01-21 | 13F | Step Capital Management Pte. Ltd. | 75.000 | 8.504 | ||||||
| 2026-02-04 | 13F | Ameritas Advisory Services, LLC | 0 | -100,00 | 0 | -100,00 | ||||
| 2026-02-17 | 13F | Altimeter Capital Management, LP | 0 | -100,00 | 0 | |||||
| 2026-02-17 | 13F | Edmond De Rothschild Holding S.a. | 37.163 | 12,06 | 4.214 | -3,88 | ||||
| 2026-02-20 | 13F/A | CMT Capital Markets Trading GmbH | Put | 203.300 | -17,12 | 23 | -28,12 | |||
| 2025-10-29 | 13F | Royal Fund Management, LLC | 0 | -100,00 | 0 | -100,00 | ||||
| 2026-02-20 | 13F/A | CMT Capital Markets Trading GmbH | Call | 446.500 | -4,78 | 51 | -18,03 | |||
| 2025-11-13 | 13F | Riggs Asset Managment Co. Inc. | 0 | -100,00 | 0 | |||||
| 2026-01-21 | 13F | Y.D. More Investments Ltd | 0 | -100,00 | 0 | |||||
| 2026-02-17 | 13F | D. E. Shaw & Co., Inc. | Put | 1.677.000 | -50,20 | 190.155 | -57,28 | |||
| 2026-02-17 | 13F | D. E. Shaw & Co., Inc. | Call | 2.207.000 | -0,92 | 250.252 | -15,00 | |||
| 2026-02-17 | 13F | State Of Wisconsin Investment Board | 7.748 | -40,57 | 879 | -49,04 | ||||
| 2026-02-13 | 13F | Gts Securities Llc | 2.079 | -93,42 | 236 | -94,37 | ||||
| 2026-02-10 | 13F | Daiwa Securities Group Inc. | 76.875 | 9,38 | 9 | -11,11 | ||||
| 2026-01-29 | 13F | Calamos Advisors LLC | Call | 0 | -100,00 | 0 | -100,00 | |||
| 2026-02-17 | 13F | Scientech Research LLC | 3.067 | 348 | ||||||
| 2026-02-12 | 13F | XY Capital Ltd | Put | 1.600 | 181 | |||||
| 2026-02-13 | 13F | Pathstone Holdings, LLC | 10.774 | 3,06 | 1.222 | -11,59 | ||||
| 2026-01-27 | 13F | Evergreen Capital Management Llc | 1.922 | -15,22 | 218 | -27,42 | ||||
| 2026-02-12 | 13F | XY Capital Ltd | Call | 1.600 | 181 | |||||
| 2026-03-16 | 13F/A | Rockefeller Capital Management L.P. | 5.569 | -29,44 | 631 | -39,50 | ||||
| 2026-02-12 | 13F | Perseverance Asset Management International | 0 | -100,00 | 0 | |||||
| 2026-01-28 | 13F | B. Metzler seel. Sohn & Co. AG | 58.208 | 113,51 | 6.600 | 83,18 | ||||
| 2026-02-17 | 13F | Hidden Lake Asset Management LP | 0 | -100,00 | 0 | -100,00 | ||||
| 2026-02-13 | 13F | Lavaca Capital Llc | 3.189 | -19,43 | 362 | -30,98 | ||||
| 2026-02-17 | 13F | Prelude Capital Management, Llc | 18.411 | 86,91 | 2.088 | 60,42 | ||||
| 2026-01-26 | 13F | KBC Group NV | 239.124 | 20,86 | 27 | 3,85 | ||||
| 2026-01-30 | 13F | Yong Rong (HK) Asset Management Ltd | 50.000 | 6 | ||||||
| 2026-02-13 | 13F | Oakum Bay Capital LLC | 1.900 | 215 | ||||||
| 2026-01-23 | 13F | Assetmark, Inc | 431 | 7,21 | 49 | -9,43 | ||||
| 2026-02-06 | 13F | True Light Capital Pte. Ltd. | 602.262 | 68.290 | ||||||
| 2026-02-11 | 13F | Myriad Asset Management Advisors LLC | 35.106 | 3.981 | ||||||
| 2026-02-17 | 13F | Blair William & Co/il | 4.079 | 63,75 | 463 | 40,43 | ||||
| 2026-02-17 | 13F | Schonfeld Strategic Advisors LLC | 0 | -100,00 | 0 | |||||
| 2026-02-17 | 13F | Schonfeld Strategic Advisors LLC | Put | 0 | -100,00 | 0 | ||||
| 2026-01-23 | 13F | Baillie Gifford & Co | 31.032.323 | -2,41 | 3.518.755 | -16,28 | ||||
| 2025-11-12 | 13F | Contrarius Group Holdings Ltd | 85.372 | -0,76 | 11.284 | 25,32 | ||||
| 2026-02-12 | 13F | CIBC Private Wealth Group, LLC | 1.092 | 0,00 | 124 | -14,58 | ||||
| 2026-01-26 | 13F | Private Trust Co Na | 141 | 28,18 | 16 | 7,14 | ||||
| 2026-03-11 | 13F | Leonteq Securities AG | Call | 0 | -100,00 | 0 | -100,00 | |||
| 2026-02-17 | 13F | Kora Management LP | 490.650 | -18,80 | 55.635 | -30,34 | ||||
| 2026-02-11 | 13F | LPL Financial LLC | 38.831 | -3,10 | 4.403 | -16,86 | ||||
| 2026-02-13 | 13F | Vontobel Holding Ltd. | 40.787 | 0,91 | 4.625 | -13,44 | ||||
| 2026-02-17 | 13F | Schonfeld Strategic Advisors LLC | Call | 0 | -100,00 | 0 | ||||
| 2026-02-17 | 13F | Royal Bank Of Canada | Put | 33.100 | 3.753 | |||||
| 2026-02-17 | 13F | Royal Bank Of Canada | Call | 30.500 | 3.458 | |||||
| 2026-02-13 | 13F | Wells Fargo & Company/mn | Put | 0 | -100,00 | 0 | -100,00 | |||
| 2026-02-10 | 13F | NINE MASTS CAPITAL Ltd | Put | 0 | -100,00 | 0 | -100,00 | |||
| 2026-01-26 | 13F | Cwm, Llc | 867 | -2,03 | 0 |